
The Two Axis Chart Widget
You can plot two metrics, one bar and one line, on the dashboard using the Two Axis Chart widget. See Widgets Overview for information about how to add each widget and additional options.
Adding Two Axis Chart Widgets to Dashboards
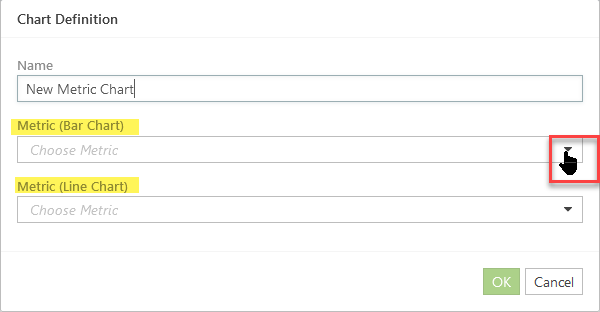
- Set up the chart.
- Enter the name for the chart in the Name field
- Select the time-series metrics to display in the chart.
- Click OK to create the chart.
- Re-size and reposition the widget, as required.
- Click the Save button to save the dashboard.
Click image to expand or minimize.
Chart Widget Options
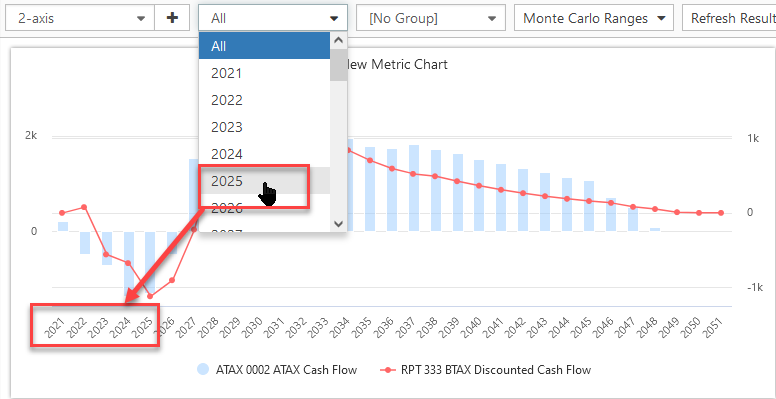
- The Group control on the Dashboard does not modify the two axis Chart.
- The Time filter control on the Dashboard will affect the two axis Chart. Metrics are displayed from the first time-period up to and including the time selected.
Click image to expand or minimize.